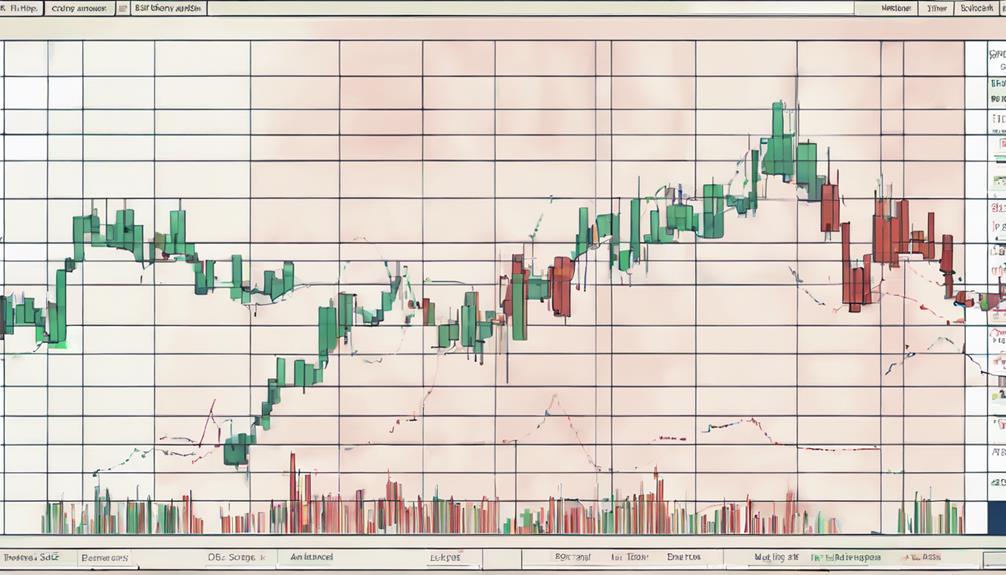
Volatility Indicators in Forex

In the fast-paced world of forex trading, understanding and mastering volatility indicators is key to improving trading precision. Volatility refers to the price fluctuations of a currency pair over a specific period. Knowing how to track and respond to these fluctuations can make a significant difference in trading outcomes. This article will explore two essential volatility indicators—Average True Range (ATR) and Bollinger Bands—and how traders can use them to their advantage.
What is the Average True Range (ATR)?
The Average True Range (ATR) is one of the most popular tools for measuring market volatility. Developed by J. Welles Wilder, the ATR provides insight into how much a currency pair is expected to move within a certain period. It doesn’t indicate the direction of price movements, but it highlights the degree of price volatility.
Key Benefits of Using ATR in Forex Trading:
- Setting Stop-Loss Levels: By understanding a currency pair’s typical price range, traders can set more accurate stop-loss orders, protecting themselves from sudden price swings.
- Determining Profit Targets: ATR helps traders identify realistic profit targets based on the average movement of a currency pair.
- Risk Management: By measuring the overall market conditions, ATR gives traders insight into whether the market is calm or volatile, helping them manage risk effectively.
How to Use Bollinger Bands in Forex Trading
Bollinger Bands, developed by John Bollinger, are another effective tool for analyzing volatility in forex markets. This indicator consists of three lines: a simple moving average (middle line) and two standard deviation lines (upper and lower bands). Bollinger Bands highlight periods of high or low volatility by tracking price movement relative to these bands.
Key Benefits of Using Bollinger Bands:
- Spotting Breakouts: When price moves outside the bands, it often signals a breakout or a reversal, helping traders capitalize on new trends.
- Recognizing Overbought and Oversold Conditions: When prices move closer to the upper band, the asset is typically considered overbought, whereas proximity to the lower band suggests oversold conditions.
- Adapting Trading Strategies: Bollinger Bands can be used for range-bound trading strategies, where traders buy when prices are near the lower band and sell when prices approach the upper band.
Using ATR and Bollinger Bands Together
By combining ATR and Bollinger Bands, forex traders can gain a more comprehensive view of market volatility. ATR can be used to gauge the general level of volatility in the market, while Bollinger Bands help in identifying specific entry and exit points. These indicators, when used together, offer valuable insights for developing adaptive trading strategies, whether in a calm or volatile market.
Start your journey today and elevate your trading game to new heights!
Never miss any important news. Subscribe to our newsletter.
Related News


USD/INR Slows Down Amid Mixed Indian PMI Data.


USD/INR Rises as Markets Anticipate Fed Rate Decision.


Gold Price Nears Record High Amid Strong Safe-Haven Demand.


USD/INR Gains Momentum Amid Trade Tariff Uncertainty.


Never miss any important news. Subscribe to our newsletter.
Editor's Pick


USD/INR Slows Down Amid Mixed Indian PMI Data.


USD/INR Rises as Markets Anticipate Fed Rate Decision.


