Menu
Indian Rupee (INR) Trims Gains Amid Cautious Market Mood
Facebook
LinkedIn

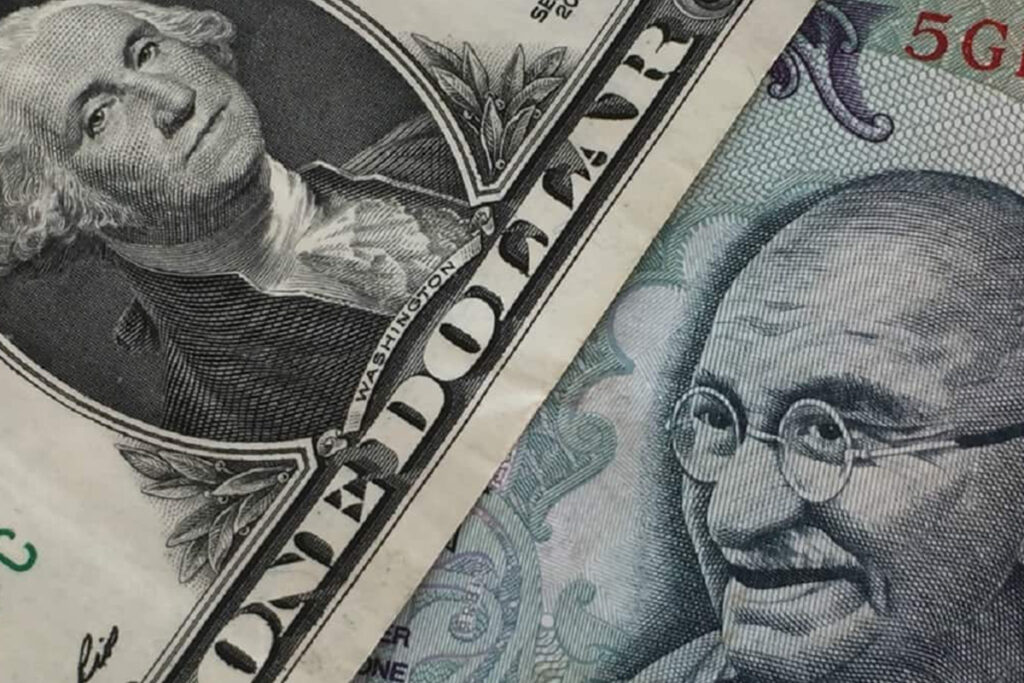
- The Indian Rupee (INR) experienced a slight decline on Monday despite a softer US Dollar (USD), after closing at a two-month high of 83.10 on Friday. This marked its largest weekly gain in over five months, driven by substantial inflows into Indian equities. The continuation of these inflows could potentially support the INR in the short term. However, rising crude oil prices and safe-haven flows amid escalating geopolitical tensions in the Middle East might bolster the USD, creating a headwind for the USD/INR pair.
Key Economic Events to Watch
US Economic Indicators:
– Investors are keenly awaiting the first reading of the US Gross Domestic Product (GDP) for Q1 2024, set to be released on Thursday.
– The final reading of the Personal Consumption Expenditures (PCE) Price Index for April will be published on Friday.
Indian Economic Indicators:
– The GDP growth figure for Q4 2023, scheduled for release on Friday, is also under close scrutiny. A weaker-than-expected performance could exert downward pressure on the INR, limiting the pair’s downside potential.
Market Movers
Indian Market Performance:
– The INR saw its most significant strengthening in five months as India’s benchmark equity indices, BSE Sensex and Nifty 50, reached record highs on Friday.
– After three consecutive quarters of impressive growth rates exceeding 8%, India’s economic growth is expected to moderate to 6.7% in Q4 2023.
Geopolitical Developments:
– The situation in the Middle East remains tense. An Israeli airstrike in Rafah, southern Gaza, resulted in at least 35 casualties. This followed a barrage of rockets launched by Hamas at Tel Aviv, escalating regional tensions.
US Economic Data:
– US Durable Goods Orders increased by 0.7% month-on-month in April, following a downwardly revised 0.8% advance in March. This exceeded economists’ expectations of a 0.8% decline.
– The University of Michigan Consumer Sentiment Index fell to 69.1 in May from 67.4 in April. One-year inflation expectations rose slightly to 3.3%, while five-year expectations dropped to 3%.
Technical Analysis
The USD/INR pair exhibits a bearish outlook on the daily chart. The pair has confirmed a breakout of the Head and Shoulders pattern formed since March 21, resuming a downward trajectory as the price remains below the key 100-day Exponential Moving Average (EMA). The 14-day Relative Strength Index (RSI) is in bearish territory at 34.65, supporting a seller-driven market.
Key Levels to Watch:
– Resistance: The support-turned-resistance level and the 100-day EMA at 83.20. Sustained buying above this level could target the high of May 13 at 83.54, the high of April 17 at 83.72, and the 84.00 round level.
– Support: A breach of the 83.00 psychological level could expose the January 15 low at 82.78, followed by the March 11 low at 82.65.
While the Indian Rupee has recently shown strength, the interplay of domestic equity inflows, geopolitical tensions, and upcoming economic data releases will be crucial in determining its near-term direction. Investors will closely monitor these factors as they navigate the evolving market landscape.
Never miss any important news. Subscribe to our newsletter.
Related News


Is Your Trading Strategy Falling Short? Here’s How to Fix It for Good
December 16, 2024


EUR/USD Struggles Near 1.0460 as ECB-Fed Policy Divergence Weighs
December 13, 2024


Australian Dollar Struggles as Strong US Dollar Awaits Key CPI Data
December 11, 2024

“Indian Rupee Nears Record Low Amid Key Challenges and USD/INR Trends
December 10, 2024

Never miss any important news. Subscribe to our newsletter.
Editor's Pick

Silver Price Prediction: XAG/USD Drops to Three-Month Low Around $29.50
December 19, 2024


Is Your Trading Strategy Falling Short? Here’s How to Fix It for Good
December 16, 2024


